

By Frank Lansner 2014. (Comment 2019: The “Original Temperatures” series was earlier posted on site “Hidethedecline.eu”, which now is not functional. This writing is kept in English because several persons outside Denmark has requested that the findings presented in the “Original Temperatures” series become online available again. The Iceland writing is the first writing from the Original Temperatures project to come back online. In this writing it is shown how 46 original datasets from Icelandic temperature stations are mutually homogeneous, but none the less NASA´s “GISS” department chooses to change Iceland temperature trends away from the homogeneous average trends. GISS calls this process “Homogenization”. Icelandic Met office did not agree with NASA that their data needed to be changed. NASA removed the long warm period before around 1960. Also ECA&D has changed data so that modern temperatures become warmer in comparison with older data, but did so by raising recent temperatures. Thus, ECA&D and GISS data are in conflict with each other. Now, back to to original posting: )
This writing builds on the methods and conclusions from the summary article: http://wattsupwiththat.com/2014/01/06/the-original-temperatures-project/
Iceland temperature data has a special focus due to its Arctic location and then the much debated GISS versions of Reykjavik and Akureyri station data.
For Iceland it has been possible to collect meteorological yearbook data from:
1912-1919 : Meteorological yearbooks from Danish National Archives
1921-1997 : Original Iceland meteorological year books
Approx. 1960 – 2013 : Online meteorological data from the Icelandic Met Office: http://en.vedur.is/climatology/data/
The online data from the Icelandic met office matches data from the printed year books.
Thus using original temperature data from Iceland, we can evaluate other data sources like GISS and ECA&D.
Fig 1
Illustration of the Iceland temperature stations used in this writing. There is a majority of stations located near the coast but fortunately we have also the interior of Iceland represented.
An interesting result from Iceland is that the difference coastal versus non-coastal (“OAS”) is small. In all other European areas analysed so far differences have been much larger.
Fig 2
The “largest” difference in trend observed was when making a compare between the 4 coastal of red area 6 in South Iceland and then the 2 valley stations further from the Coast, Akureyri and Grimsdadir.
We see that the coastal stations have smaller variance in temperature than the non-coastal stations.
The delay in the coastal temperatures is relatively small, just around one decade.
However, both the coastal and non-coastal station used show that temperatures today resemble the mid 20´ieth century temperatures.
Fig 3
Temperature average trends from all 7 areas from Iceland’s coast line + the series “OAA” (stations marked black on fig 1) show remarkable similarity.
In the following, the average of the 7 coastal areas (35 stations) will be labelled as “Coastal”.
ECA&D
Fig4
According to ECA published data, Reykjavik’s temperatures show a strong warming even after the warm peak 2003 – see the red graph.
The ECA-jump in Reykjavik temperatures after 2004 is not supported by original Reykjavik data nor the average of 35 coastal Iceland stations.
Fig 5
Also for the coastal Stykkisholmur station ECA have warm adjusted temperatures after 2004.
Fig 6
Likewise for Dalatangi.
Fig7
For Vestmannaejar I have not found the original data after 2004, but we can see that ECA´s data appear to leave the average coastal trend also around 2004.
Since the Icelandic Met Office themselves presents the 2004-2013 data online, this suggests that ECA&D them selves made the adjustments? “Homogenizations” ?
GISS
Fig 8
This Climate4you graphic shows quite well how come GISS adjustment of Arctic has alarmed many sceptics.
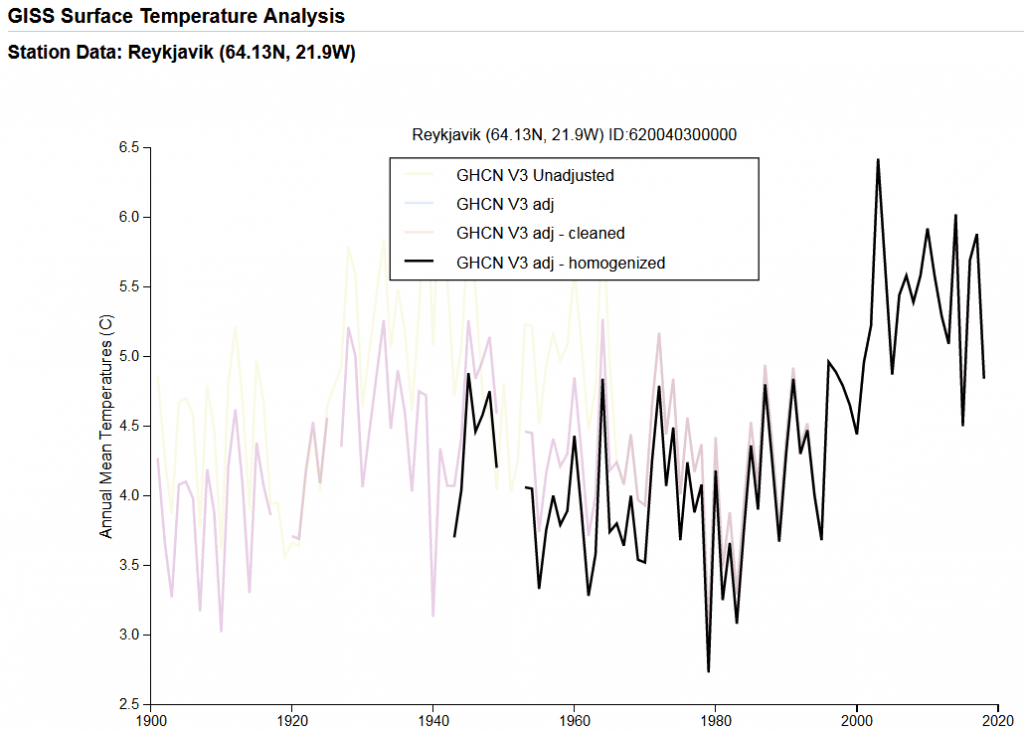
Fig 9
First we can conclude that GISS has not produced a warm trend in Reykjavik data in the same way ECA&D did. GISS cold adjusts older data while ECA warm adjust recent temperatures. Thus, GISS adjustments are not backed up by ECA and vice versa.
Notice also that the GISS cold adjustment of older data 1930-1965 make the Reykjavik data strongly different from the average of 35 Iceland coastal datasets.
Fig 10
Likewise, the GISS Akureyri adjustment makes the past colder and thus creates a warm trend after 1930 that was never there.
COASTAL AREAS:
Fig 11
Fig 12
Fig 13
Fig14
Fig15
Fig 16
Fig 17
Fig 18
Fig 19
UPDATES May 2019: The appearance og NASA´s GISS Icelandic station data keep changing. This is the situation right now, 22 May 2019, at 12:12 CET:
NASA GISS Reykjavik: https://data.giss.nasa.gov/cgi-bin/gistemp/stdata_show.cgi?id=620040300000&ds=5&dt=1
ECA&D data: https://www.ecad.eu//indicesextremes/index.php
Note: Per 22 May 2019 ECA&D data are not available. These data were available at least in 2018.


Vi kan kun gentage, at det ikke er blevet meget varmere de sidste 15 år. CO2 alene uden andre faktorer bidrager med 3.2 grader pr procent stigning. 0% ville betyde en global middeltemperatur på minus 30 grader , 100% 290 grader. Hvad bidrager de andre spillere med? Vanddamp, metan, Jordens magnetfelt, kosmisk stråling, Solpletter og deraf stråling, byklima. jetstrømme, El Nino og El Nina. isdække, snedække, fotosyntese, plantedække, nedbørmønstre, m.fl. Er der nogen her blandt klimarealisterne, der kan give os en liste over hver spillers bidrag opvarmning/afkøling. Så må differencen mellem summen af enkeltspilleres bidrag og de reele målinger fortælle noget om styrken af synergieffekten. Det er formodentlig vanddampen, der får CO2 effekten til at syne større. Jeg har interesseret mig for vejr og klima i over 60 år= to klimaperioder. Lad os få tallene så kan vi selv fortolke dem. Mvh Martin Hjelmborg, Ålykken 21 6710 Esbjerg V.